
By: Andrew B. Noto, Investment Advisor Representative
If there is one thing that has been apparent in 2020 it is that the stock market does not like uncertainty. The S&P 500 closed down 64 points today after a late afternoon rally of 36 points, a daily decline of 1.86%. With a day of market activity like today, it is another clear example of how uncertainty has driven the markets lower. There are several things that are weighing heavy on the minds of investors right now with two issues taking center stage. The first is the highly contentious US Presidential Election that is just 8 days away and the second is a recent surge in COVID-19 cases across the globe.
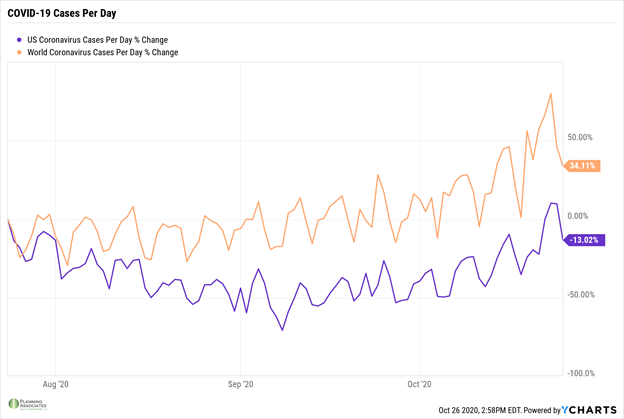
The recent uptick in COVID-19 cases across the world has many investors wondering whether we will see another economic shutdown like we did in the spring. We maintain the position that a total shutdown like we experienced earlier this year is not in the cards due to the damage it could cause to the global and US economy. We could certainly see many companies extend their work from home policies until we arrive at a vaccine which will continue to cause loses for businesses in highly concentrated areas. As you can see with the chart below, though the COVID-19 daily cases worldwide have increased over 34% in the last three months, the United States has seen a decrease in daily cases by 13%. The United States is far from having a handle on the virus completely, but we have adjusted accordingly as we learn more and more about this virus through testing, mitigation, and other efforts. Also, while infection rates continue to go up, the mortality rate among those infected has steadily declined. This is likely due to the improved ability to treat the virus.
As scary as it may seem, COVID-19 is “old news” to investors with the presidential election on the horizon. As the presidential election draws closer and the outcome seems more uncertain, many investors are choosing to sit on the sidelines until the dust settles. We receive lots of questions from concerned investors asking us how the outcome will affect their portfolio overall. Unfortunately, it is not an easy question to answer so consider three main points.
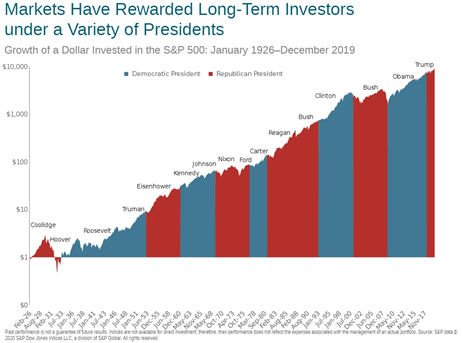
The first is the performance of the S&P 500 under each president since 1926. As you can see from the chart below, the market has performed well under both Democratic and Republican lead White Houses. In fact, some presidents benefited more than others from the timing of their presidential tenure. For example, President Obama entered the White House in January of 2009 at the tail-end of the Great Recession. During his presidency, he saw the S&P 500 bottom out in March of 2009, less than 60 days after his inauguration, which was followed by almost 8 years of gains totaling almost 300% when you factor in dividends. We can argue whether it is was his policy that drove the market higher, but there is no argument that he entered the White House at the end of a downward cycle in the market.
Secondly, we do not know how much of the policy that each candidate is promising, if they were to be elected, will come to fruition. Without a complete sweep in the White House and Congress, it will be very difficult for either candidate to successfully pass through these ideas without much resistance. Regardless of how you feel about that current state of the United States of America, this is one of the beauties of the way our country and government was constructed many years ago. With the three branches of government, there will always be a system of checks and balances in place to avoid a complete overhaul of government and policies. That does not mean there cannot be a gradual shift in thinking and policy over time, but rarely will we see quick, radical shifts that other countries experience.
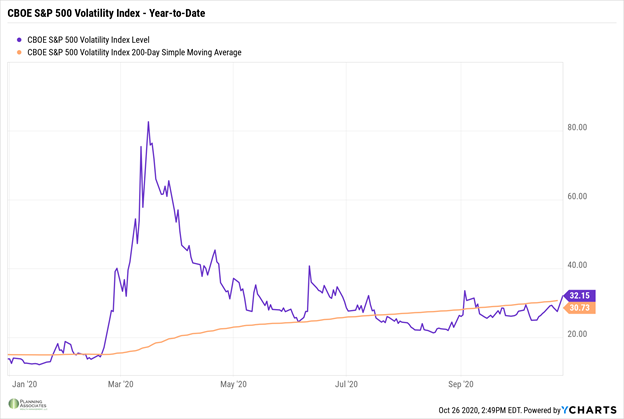
The last is considering your investment time horizon. If a move like today’s move in the stock market greatly concerns you, then we certainly need to discuss your current risk structure of your portfolio. Remember, uncertainty equals volatility in the market. The CBOE (Chicago Board Options Exchange) Volatility Index, often referred to as “the VIX”, is an index designed to measure the expectation of future volatility in the market over the coming 30 days and is simply a statistical measure of the degree of variation in trading price over a period of time (1). Though the VIX can be quite complicated, volatility is a simple measure of risk. The greater the volatility, the wider range of outcomes are possible hence the unpredictability. The lesser the volatility, the narrower the range of outcomes exist which provides greater certainty.
In the last five US Presidential Elections dating back to the contentious Bush-Gore race of 2000, the VIX has been at or above its 200-day moving average on Election Day four of those five elections. The only election where we saw the VIX below its 200-day moving average was the lightly opposed re-election of President Barack Obama in 2012 when he defeated Republican nominee Mitt Romney. Where is the VIX today you may ask? It is above its 200-day moving average and will most likely remain there come Election Day next Tuesday as you can see with the chart below.
This volatility we are experiencing is expected. We have experienced similar uncertainty during majority of the presidential elections for the last two decades. Sure, this election may feel more contentious than others due to the polarizing candidates involved, the social unrest in our country, and the fact that we are in the midst of global pandemic, but the fact that we are seeing volatility in the stock market should not come as a surprise. And yes, the media will try to sell you that this is the most important election of your life which is true, until the next election comes around and you are called to complete your civic duty. Though our firm will never endorse a presidential candidate, we will always encourage you to exercise your right to vote if you have not done so already.
If you have any questions about your portfolio or anything else at this time, please give us a call so we can assist you.
(1) Investopedia.com
This commentary reflects the personal opinions, viewpoints and analyses of Planning Associates Wealth Management, LLC employees providing such comments, and should not be regarded as a description of advisory services provided by Planning Associates Wealth Management, LLC or performance returns of any Planning Associates Wealth Management, LLC client. The views reflected in the commentary are subject to change at any time without notice. Nothing in this commentary constitutes investment advice, performance data or any recommendation that any particular security, portfolio of securities, transaction or investment strategy is suitable for any specific person. Any mention of a particular security and related performance data is not a recommendation to buy or sell that security. Planning Associates Wealth Management, LLC manages its clients’ accounts using a variety of investment techniques and strategies, which are not necessarily discussed in the commentary. Investments in securities involve the risk of loss. Past performance is no guarantee of future results.
Recent Comments